Why One-Off Scans Are Not Enough
Three weeks after Pawsman.com finished their remediation (from Parts 1 and 2), a new engineer ran this command during a debugging session:
kafka-configs.sh --bootstrap-server kafka-prod:9092 \
  --alter --entity-type brokers --entity-default \
  --add-config auto.create.topics.enable=true
KG-028 failed again. Nobody noticed for four days — until the weekly scan.
This is the drift problem. Kafka security configuration erodes over time. Engineers make changes during incidents. New brokers join the cluster with default settings. A compliance scan from six weeks ago proves nothing about today.
The solution: continuous monitoring. Automated nightly scans with Slack alerts when score drops below threshold. This is Part 3 of the Pawsman.com guide.
Step 1: Deploy the On-Prem Stack
The KafkaGuard dashboard runs as a Docker Compose stack alongside your Kafka infrastructure. It requires:
- Postgres 16 — stores clusters, scans, findings, users
- Redis 7 — job queue for scan processing
- MinIO — stores raw scan report files (JSON/PDF/CSV)
- API server — REST API, auth, license validation
- Worker — processes uploaded scans, extracts findings
- Dashboard — Next.js web UI
All of this ships in a single docker-compose.onprem.yml file bundled with the release.
1. Download the On-Prem Bundle
# macOS Apple Silicon
curl -LO https://github.com/KafkaGuard/kafkaguard-releases/releases/download/v2.3.0/kafkaguard-onprem-v2.3.0-Darwin_arm64.tar.gz
shasum -a 256 -c bundle-checksums.txt  # optional integrity check
tar -xzf kafkaguard-onprem-v2.3.0-Darwin_arm64.tar.gz
cd kafkaguard-onprem-v2.3.0/
The bundle contains everything you need:
kafkaguardCLI binarydocker-compose.onprem.ymlenv.onprem.example→ rename to.env.onpreminstaller/— backup, restore, upgrade, check-ports scriptspolicies/— baseline-dev, enterprise-default, finance-iso
2. Configure and Start
# Configure environment
cp env.onprem.example .env.onprem
# Edit .env.onprem — set POSTGRES_PASSWORD, MINIO_SECRET_KEY, JWT keys

# Start the stack
docker compose -f docker-compose.onprem.yml --env-file .env.onprem up -d
Services start in order:
✓ postgres-1      healthy   Port 5432
✓ redis-1         healthy   Port 6379
✓ minio-1         healthy   Ports 9002 (API), 9003 (console)
✓ kafkaguard-api  healthy   Port 3001
✓ kafkaguard-worker         (no port — internal worker)
✓ kafkaguard-dashboard      Port 3000
Open the dashboard: http://your-server:3000
Step 2: First Login — The /setup Page
Open http://your-server:3000. Since this is a fresh install, KafkaGuard automatically redirects you to the setup page — no curl commands, no forced password change on first sign-in.
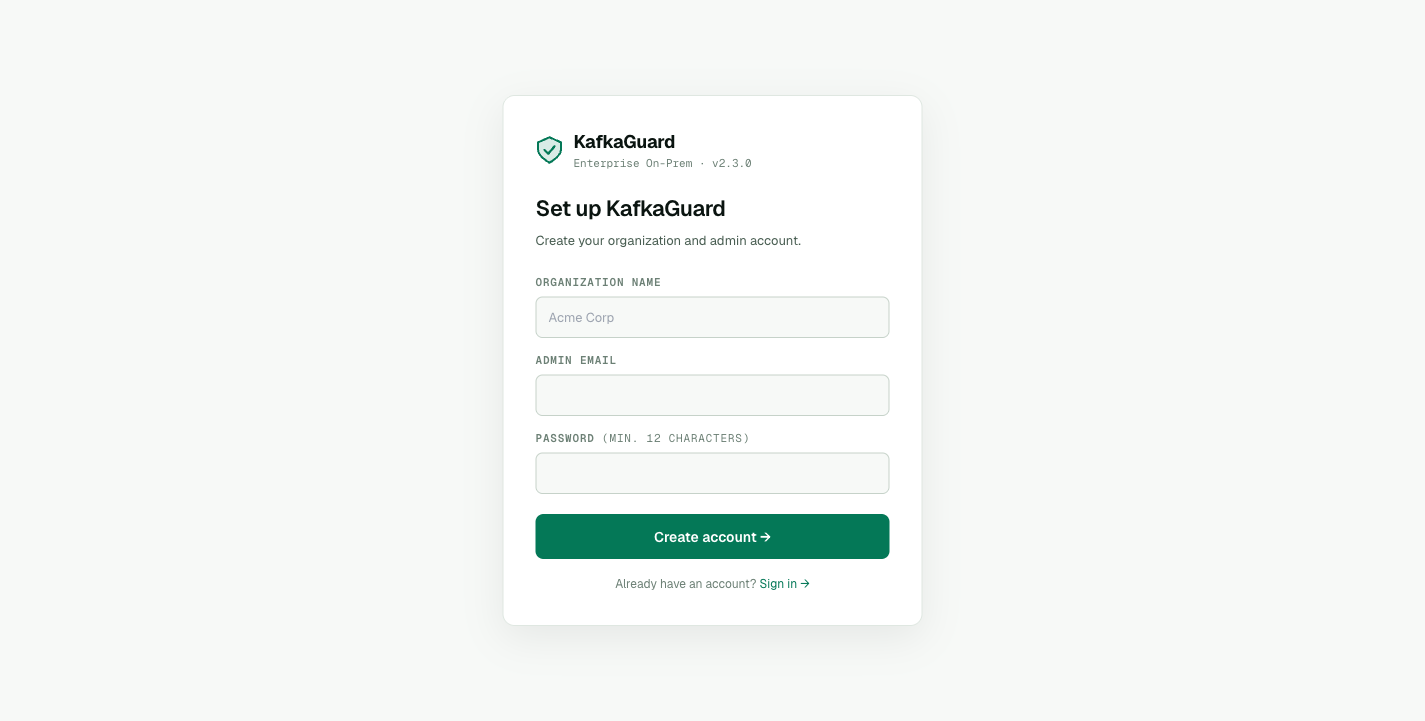 The first-run setup page — fill in org name, email, and password. KafkaGuard detects an unseeded database and walks you straight to this form.
Pawsman's security team fills in:
- Organization name: Pawsman.com
- Admin email: security@pawsman.com
- Password: (min. 12 characters)
Click Create account →. You're logged in directly — your admin session is created in one step.
Empty Clusters View
The first thing you see after setup is the Clusters page in its empty state, with a copy-pasteable scan command to get you started:
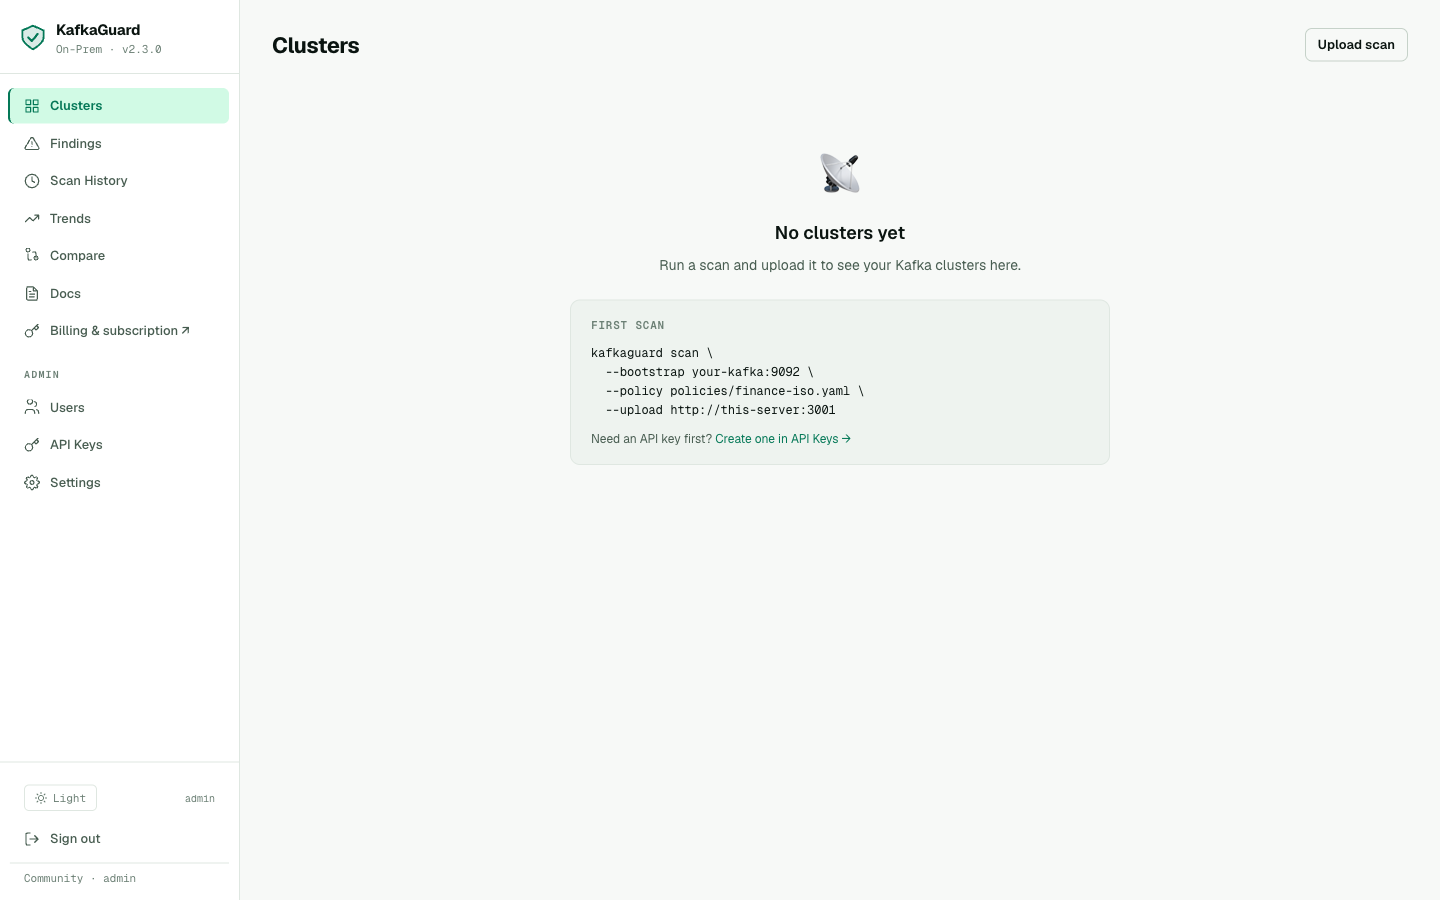 Empty Clusters view — KafkaGuard tells you exactly what command to run for your first scan and where to grab an API key.
Step 3: Create an API Key
API keys authenticate the CLI when uploading scan results to the dashboard.
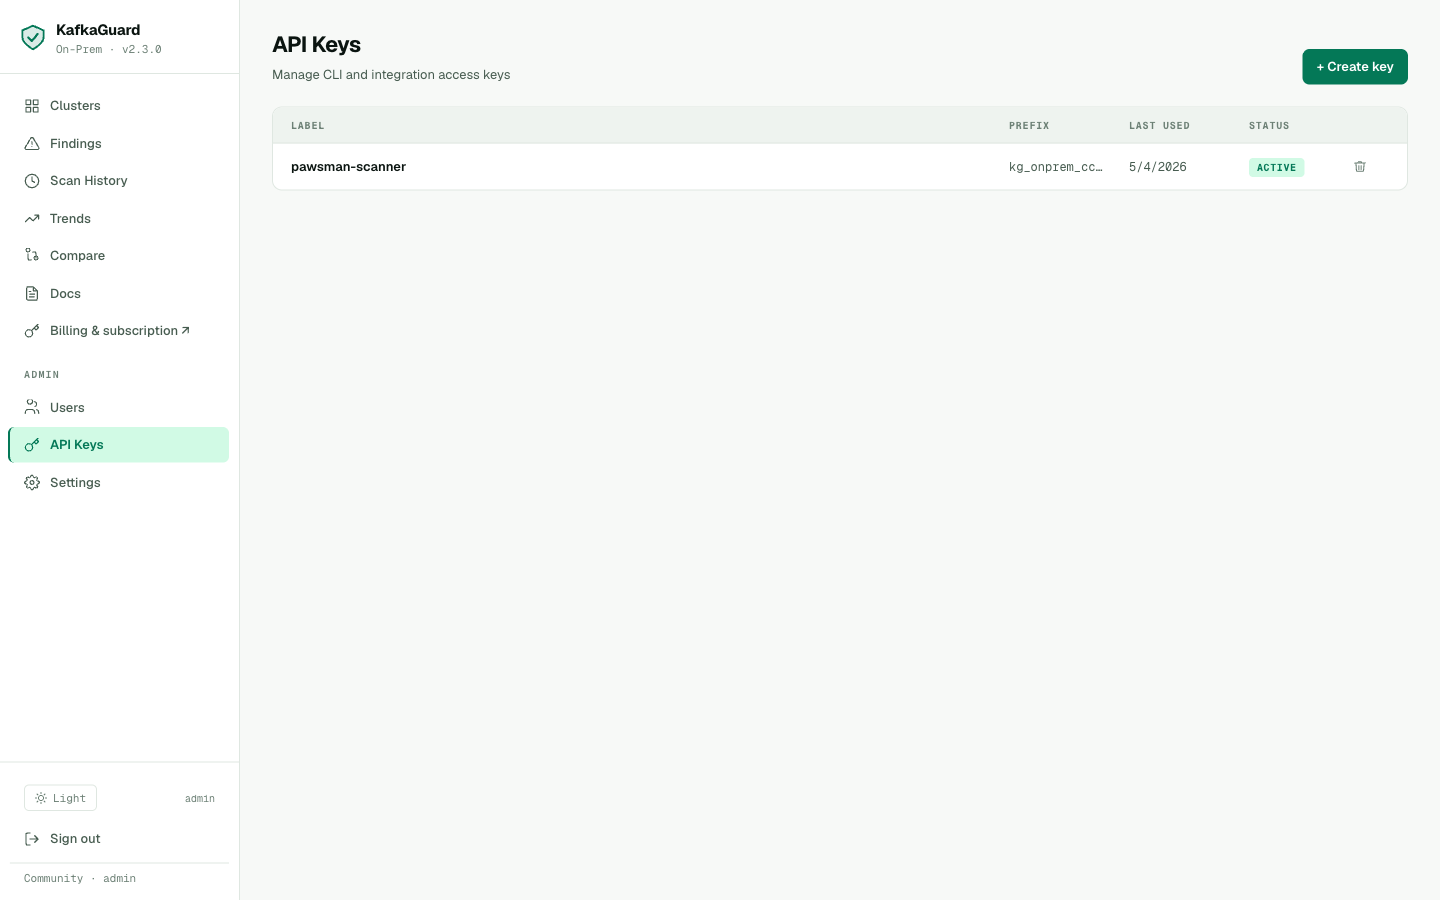
Admin → API Keys. Create one key per environment (prod, staging, dev) for attribution in scan history.
Go to API Keys → Create key, label it pawsman-scanner, and copy the generated key — it starts with kg_onprem_.
export KAFKAGUARD_API_KEY=kg_onprem_xxxxxxxxxxxxxxxxxxxx
Step 4: Upload the First Scan
Now wire the CLI to the dashboard with the --upload flag:
kafkaguard scan \
  --bootstrap pawsman-kafka-01:9092 \
  --policy policies/finance-iso.yaml \
  --format json,html,pdf,csv \
  --out ./reports \
  --upload http://kafkaguard-api:3001
...
✅ Scan complete!  scan_id=953cec2e  duration=107ms
✅ Scan results uploaded  endpoint=http://kafkaguard-api:3001
The upload flow — CLI posts the scan to the API, the worker processes it in the background, findings are extracted and stored.
Step 5: The Clusters View
Navigate to Dashboard → Clusters:
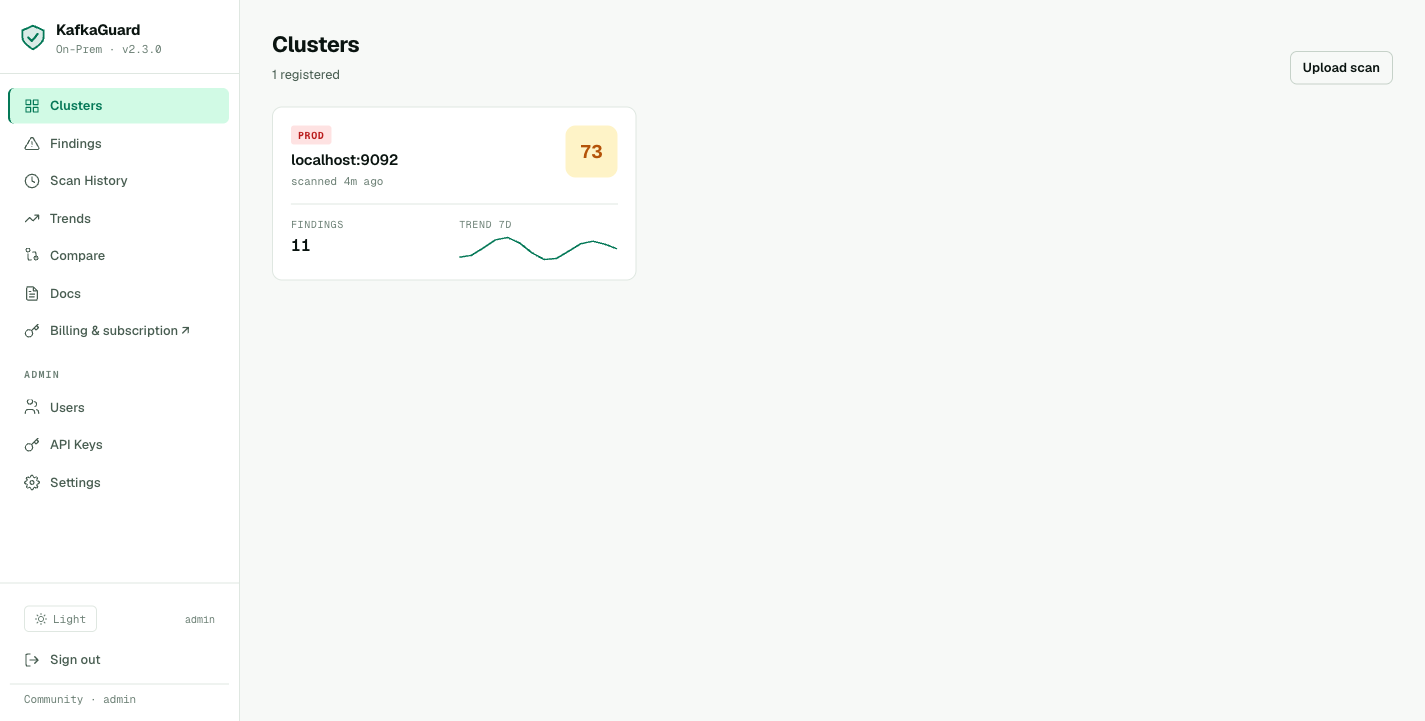
Each cluster card shows compliance score, environment tag, open finding count, and a 7-day trend sparkline.
Pawsman's cluster appears immediately after the first upload. The card shows:
- Score: 68 (the first finance-iso scan from Part 2)
- Environment: prod
- Open findings: 16
- Trend (7 days): sparkline shows score over recent scans
Step 6: Findings Explorer
Navigate to Dashboard → Findings:
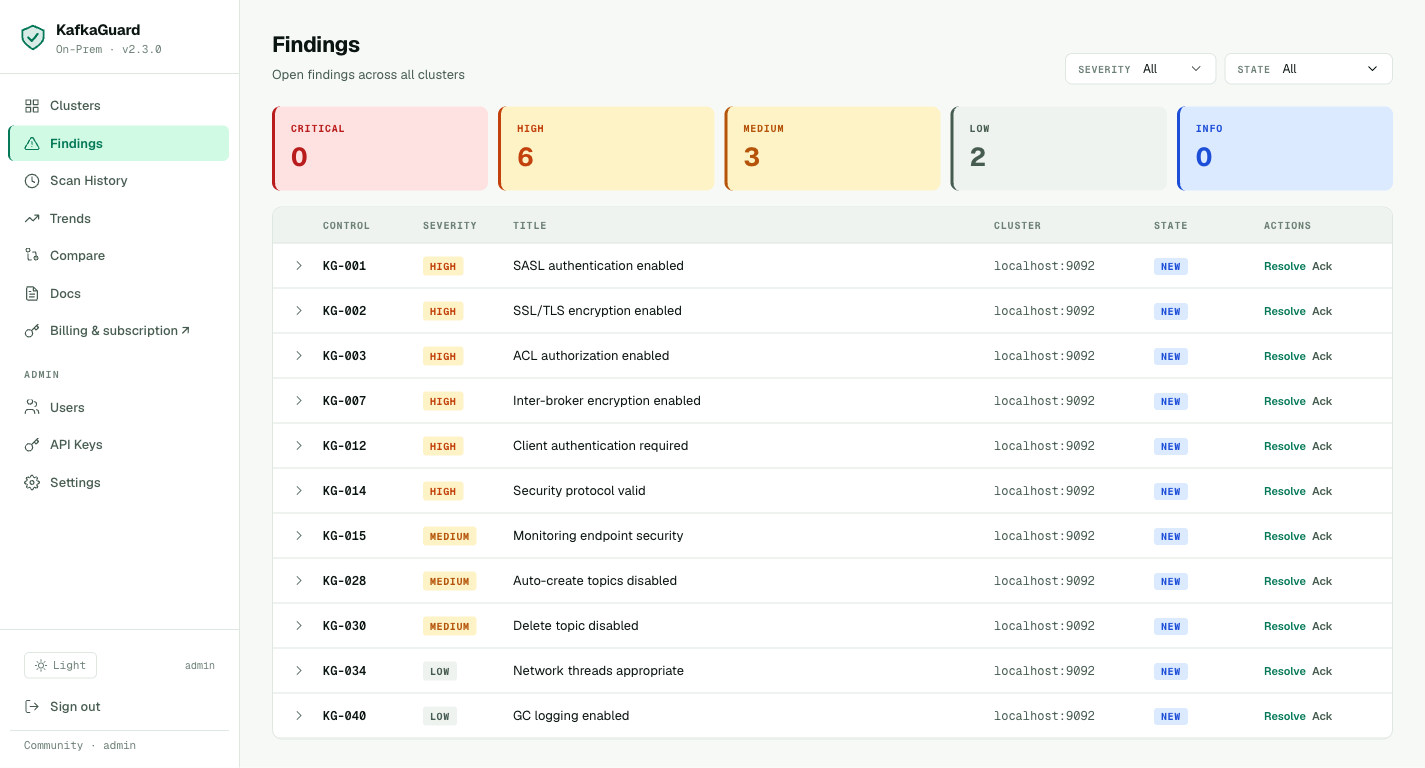
Filter by severity. Every HIGH-severity finding for Pawsman: 9 controls, all security-related.
The findings explorer shows every control that failed, with severity badges (HIGH, MEDIUM, LOW), state tracking (NEW, acknowledged, resolved), and one-click Resolve / Ack actions per row.
Click the chevron next to any finding to expand the inline remediation guidance — the exact server.properties change needed, with KRaft-specific notes where applicable.
Step 7: Set Up Nightly Scanning with Slack Alerts
The cron job that prevents drift. Runs every night at 2am, fires a Slack alert if the score drops below 85%:
# crontab -e
0 2 * * * KAFKAGUARD_API_KEY=kg_prod_xxx \
  /usr/local/bin/kafkaguard scan \
  --bootstrap pawsman-kafka-01:9092 \
  --policy policies/finance-iso.yaml \
  --format json \
  --out /var/log/kafkaguard/$(date +\%Y-\%m-\%d) \
  --upload http://kafkaguard-api:3001 \
  --alert-slack-webhook https://hooks.slack.com/services/T.../B.../... \
  --alert-threshold 85 \
  --dashboard-url http://kafkaguard:3000 \
  >> /var/log/kafkaguard/cron.log 2>&1
When a control fails that wasn't failing yesterday, the Slack message fires immediately:
🛡️ KafkaGuard Alert — pawsman-kafka-prod
Score dropped: 87% → 71%  (threshold: 85%)

❌ New failures (2):
   KG-028 [MEDIUM]  Auto-create topics disabled
   KG-003 [HIGH]    ACL authorization enabled

📊 39 passed · 16 failed · 0 N/A
🔗 View in dashboard → http://kafkaguard:3000/dashboard/clusters/1
This is what catches the drift incident. The engineer's auto.create.topics.enable=true change fires an alert within hours of the nightly scan.
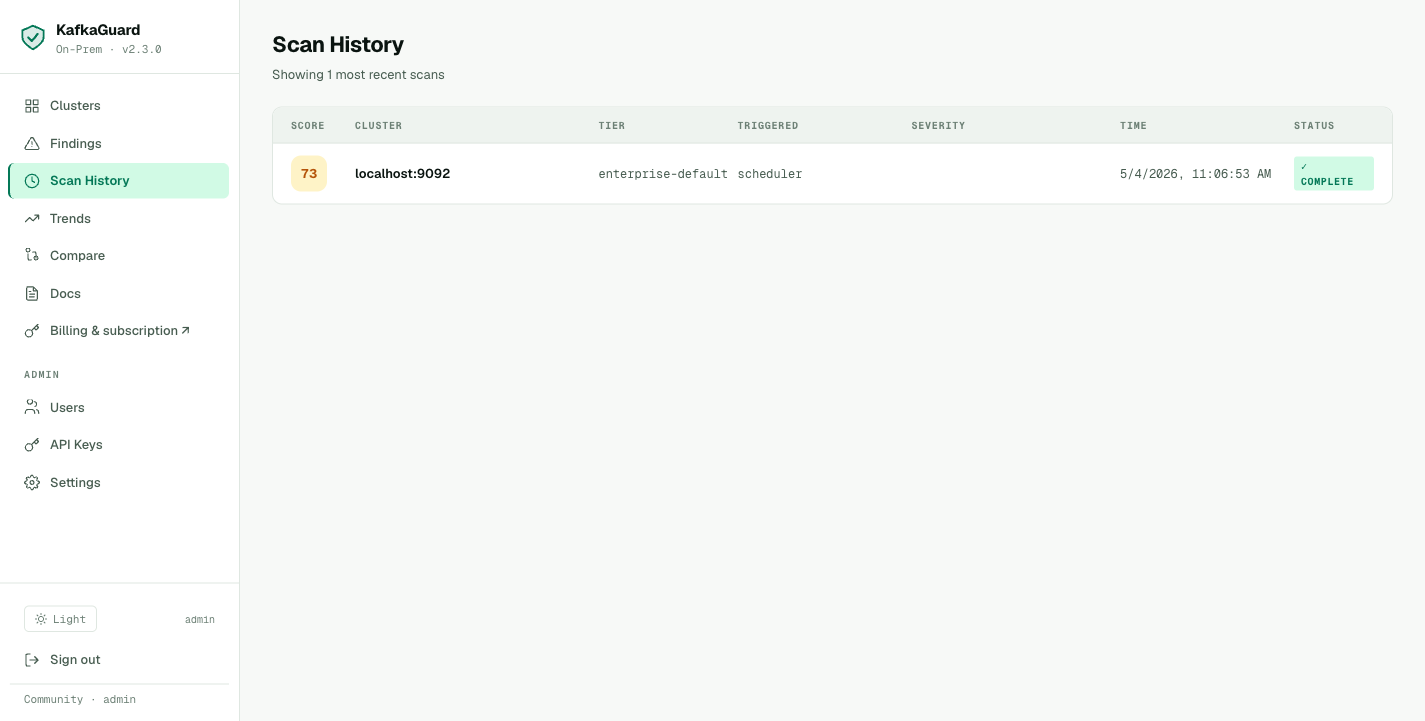
Step 8: Scan History
After a few weeks of nightly scans, the Scan History view shows every run:
Timeline of scans across all clusters — score trend, policy used, scan duration, and who uploaded it.
Pawsman can see their remediation progress clearly:
- May 3: 67.8% (initial baseline)
- May 10: 71.2% (after KG-028, KG-030 remediation)
- May 17: 84.3% (after SASL + TLS enabled on non-payment topics)
- May 24: 89.6% (after ACLs + audit logging enabled)
Step 9: Trend Charts
Navigate to Dashboard → Trends:
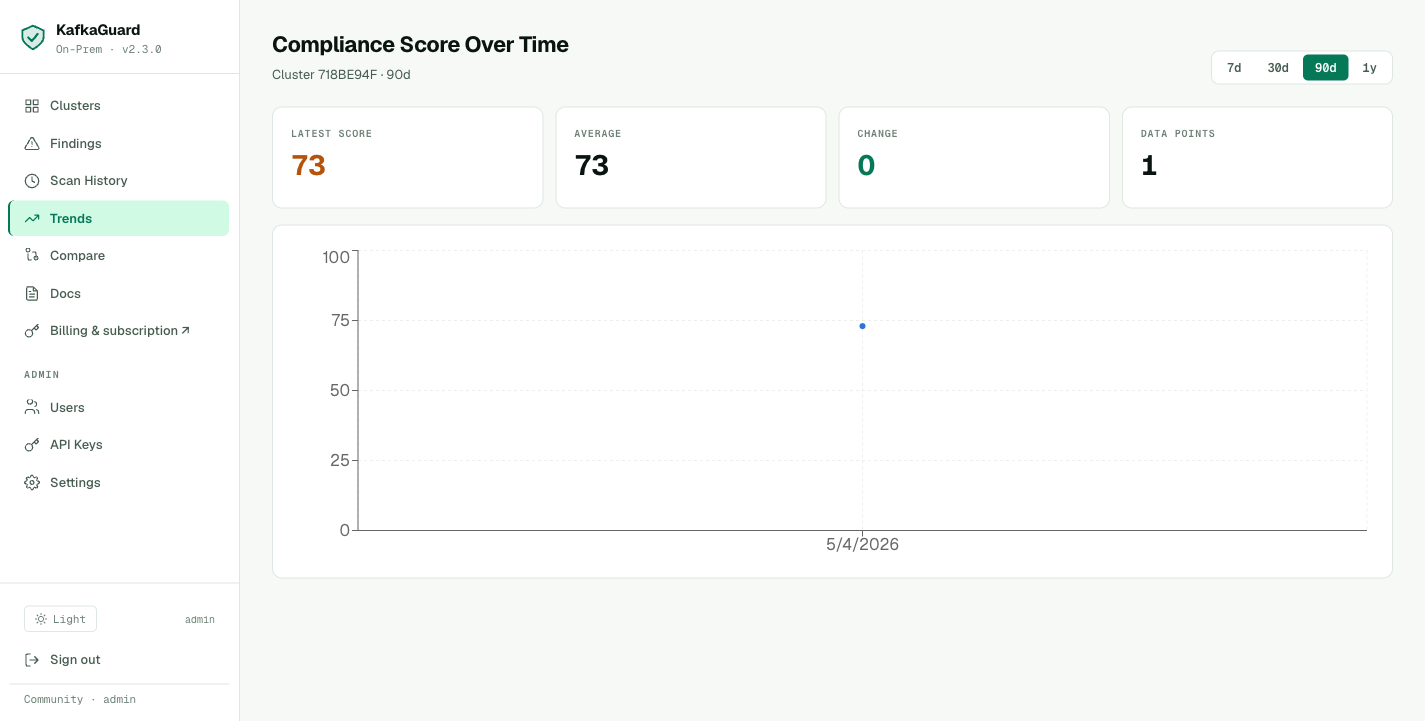
Compliance score over time with regression highlighting in red. The dip on May 7 is the drift incident — caught and fixed within 24 hours.
The trend chart shows the full remediation arc. Select 30d, 90d, or 1y periods. Regressions (score drops) are highlighted in red — making it easy to correlate incidents with configuration changes.
Fleet Compare
As Pawsman adds a staging cluster to Starter, the Fleet Compare view shows both clusters side-by-side:
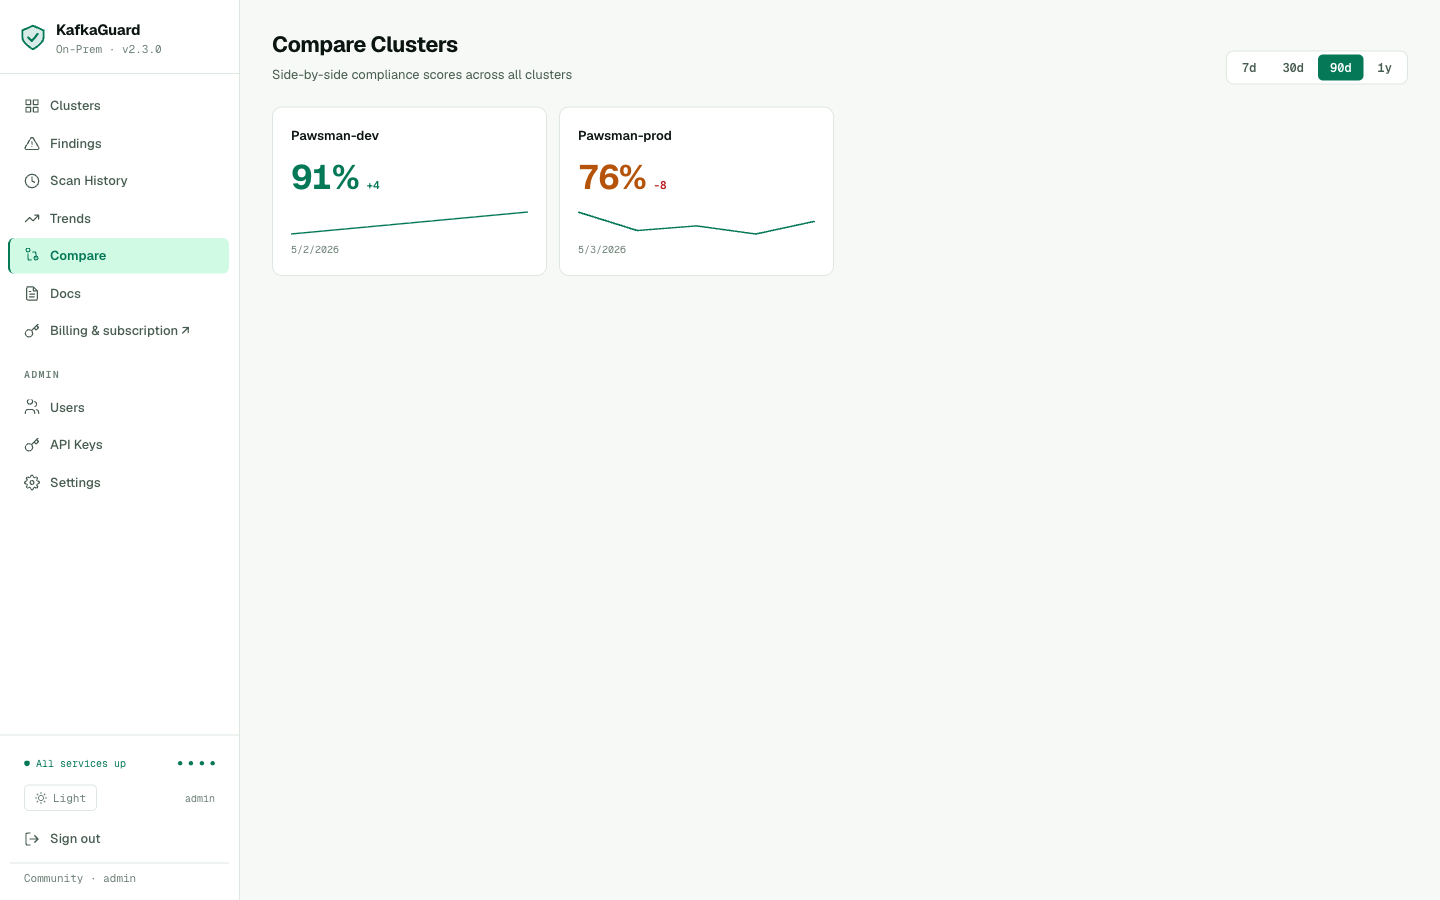
Fleet compare — all clusters ranked by compliance score with delta badges showing week-over-week change. Green = improving, red = regression.
Step 10: License Activation
The Community tier (free, single cluster) has been running all the scans above. For Pawsman's SOC 2 audit, there's one feature they need from a paid tier: compliance framework mapping in reports — the PCI-DSS, SOC 2, and ISO 27001 IDs on every finding.
They upgrade to Starter ($99/cluster/month).
Dashboard — Community Mode + In-Browser Activation
Before activation, the Settings page shows Community mode along with usage bars, machine fingerprint, and a single license input to upgrade in place — no SSH, no CLI commands, no container restart:
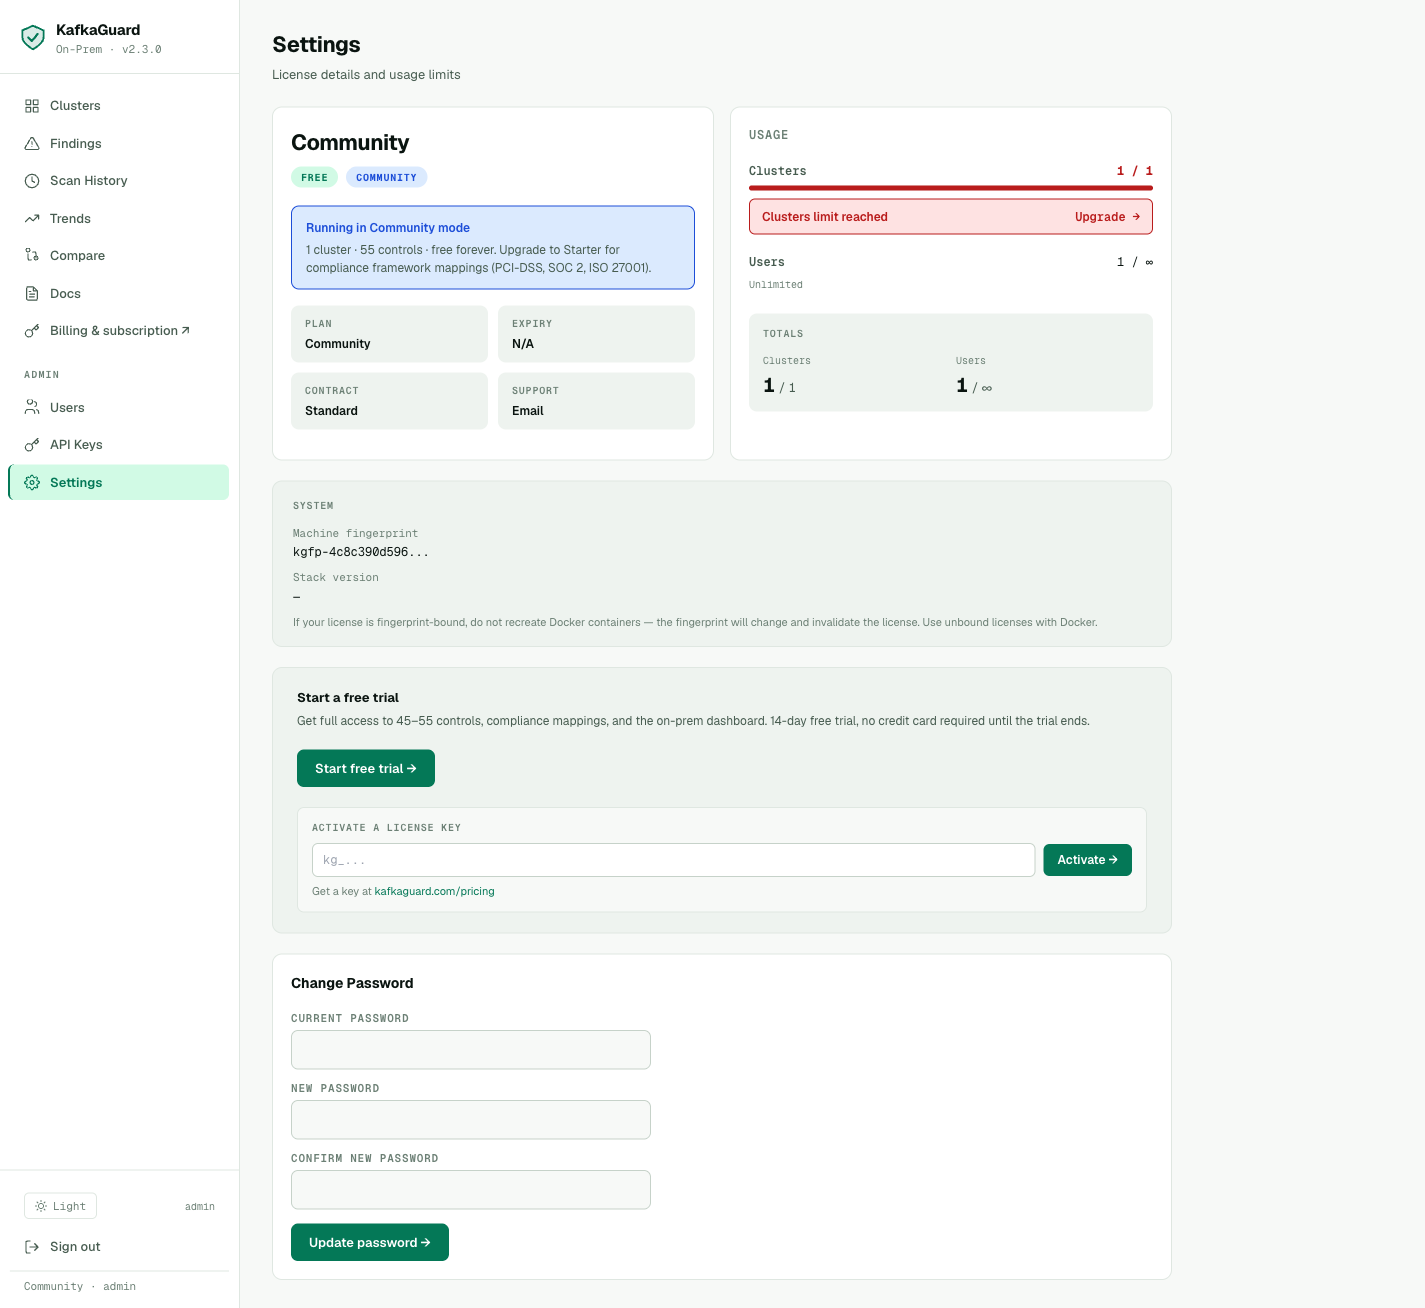 Settings → paste your
 kg_… key into the Activate a license key field → click Activate → tier updates instantly. The page also shows the machine fingerprint (for fingerprint-bound licenses) and a Change Password panel for self-service.
Purchasing a License
Go to kafkaguard.com/pricing, click Start free trial on the Starter plan. After checkout, a license key arrives by email — it starts with kg_.
Activating
Paste the kg_… key into the Activate a license key field on the Settings page and click Activate →. That's it — the dashboard refreshes the license in place and the tier badge flips from COMMUNITY to STARTER. No restart, no CLI required.
Tip — fingerprint-bound vs. unbound licenses: Pawsman runs the dashboard in Docker. If your license is fingerprint-bound, do not recreate Docker containers — the fingerprint will change and invalidate the license. Use unbound licenses with Docker.
Forgot Your Password?
The login page now has a self-service Forgot password? link with clear guidance for on-prem customers:
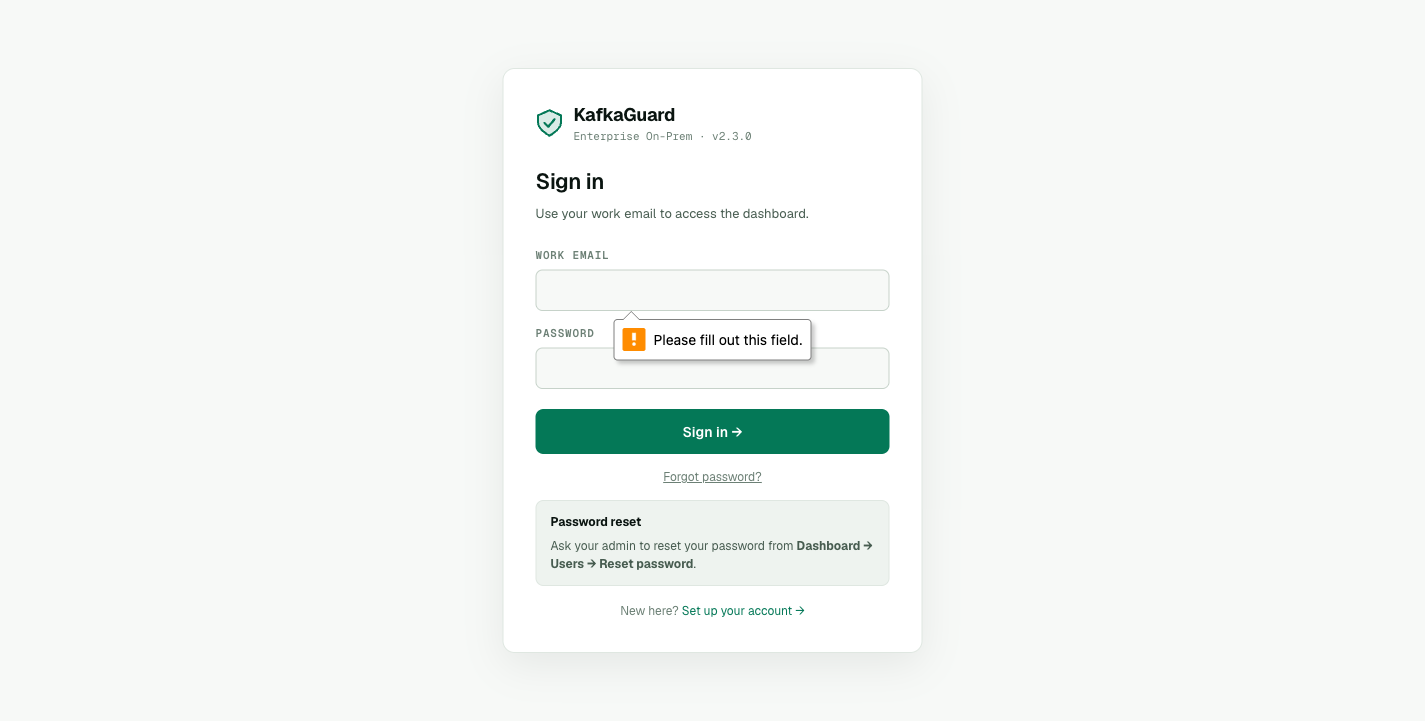 The "Password reset" panel tells users exactly what to do — ask their admin to use Dashboard → Users → Reset password — instead of bouncing to a dead-end SaaS page.
Step 10b: Upgrading the Stack
When KafkaGuard ships a new release, the bundle includes a single upgrade script:
./installer/upgrade.sh 2.4.0
# Creates backup → pulls new images → restarts containers → health check ✅
You can also check whether your CLI itself is on the latest release:
kafkaguard version --check
# KafkaGuard v2.3.0
# Commit: b0e84f7
# Built:  2026-05-03T18:17:58Z
# Go:     go1.25.3 darwin/arm64
#
# ✅ You are on the latest version (v2.3.0)
For air-gapped environments, add --offline to skip the GitHub network call.
Step 11: Team Management
Add the security team members who will review findings via Admin → Users → + Invite user.
security@pawsman.com    Admin      (can manage everything)
devops@pawsman.com      Operator   (can upload scans, acknowledge findings)
cto@pawsman.com         Read-only  (view reports for audit reviews)
Operators upload scans and acknowledge findings. Read-only users — like the CTO and external auditors — can view reports and download PDFs but cannot modify anything.
Six Weeks Later — Pawsman Passes Their SOC 2 Audit
Here's the final finance-iso scan after remediation:
kafkaguard scan \
  --bootstrap pawsman-kafka-01:9092 \
  --policy policies/finance-iso.yaml \
  --format pdf \
  --out ./soc2-final-report
✅ Scan complete!
   Score:   89.6%
   Passed:  49 of 55 controls
   Failed:  6 (4 LOW, 2 MEDIUM — no HIGH failures)
   Scan ID: 7a4f91bb
From 67.8% to 89.6% in six weeks. Every HIGH-severity control passes. The six remaining failures are LOW and MEDIUM operational items that are documented with risk acceptance in the SOC 2 evidence package.
The PDF generated by this scan — with compliance mapping to PCI-DSS, SOC 2, and ISO 27001 on every control — goes directly to their auditor. The auditor signs the sign-off page on the PDF's last page.
SOC 2 Type II surveillance period begins.
The Complete KafkaGuard Stack — What Pawsman Runs
pawsman-kafka-01:9092  ─── nightly ───► kafkaguard CLI
                                           │
                                           ▼ --upload
                              kafkaguard-api:3001
                                           │
                                     [worker queue]
                                           │
                              Postgres ─── findings DB
                              Redis    ─── job queue
                              MinIO    ─── report storage
                                           │
                              dashboard:3000
                                    │
                              Slack webhook ◄── nightly alert if score < 85%
Total infrastructure cost: ~4 CPU, 8GB RAM, 50GB disk. Runs on a single VM alongside their monitoring stack.
Summary: The Three-Part Journey
| Part 1 | Part 2 | Part 3 | |
|---|---|---|---|
| Policy | baseline-dev (21 controls) | finance-iso (55 controls) | Continuous |
| Score | 83.8% | 67.8% (initial) → 89.6% (final) | Monitored daily |
| Reports | JSON, HTML | JSON, HTML, PDF, CSV | Dashboard + alerts |
| Compliance mapping | None | PCI-DSS, SOC 2, ISO 27001 | Included in every scan |
| Tier | Community (free) | Community (free) | Starter ($99/mo) |
| Time to complete | 30 minutes | 2 hours (scan + analysis) | 45 minutes (setup) |
Quickstart — The Full Three-Part Stack
1. Download the KafkaGuard On-Prem Bundle
# macOS Apple Silicon
curl -LO https://github.com/KafkaGuard/kafkaguard-releases/releases/download/v2.3.0/kafkaguard-onprem-v2.3.0-Darwin_arm64.tar.gz
tar -xzf kafkaguard-onprem-v2.3.0-Darwin_arm64.tar.gz
cd kafkaguard-onprem-v2.3.0/
sudo mv kafkaguard /usr/local/bin/

# Linux x86_64
curl -LO https://github.com/KafkaGuard/kafkaguard-releases/releases/download/v2.3.0/kafkaguard-onprem-v2.3.0-Linux_x86_64.tar.gz
tar -xzf kafkaguard-onprem-v2.3.0-Linux_x86_64.tar.gz
cd kafkaguard-onprem-v2.3.0/
sudo mv kafkaguard /usr/local/bin/

# Verify
kafkaguard version
# KafkaGuard v2.3.0
# Commit: b0e84f7
# Built:  2026-05-03T18:17:58Z
# Go:     go1.25.3 darwin/arm64

# Check for updates (optional, skip with --offline)
kafkaguard version --check
2. Run your first scan (free, no account)
kafkaguard scan \
  --bootstrap your-kafka:9092 \
  --policy policies/finance-iso.yaml \
  --format json,html,pdf,csv \
  --out ./audit
3. Deploy the dashboard (optional, free for 1 cluster)
docker compose -f docker-compose.onprem.yml --env-file .env.onprem up -d
# Dashboard: http://localhost:3000
4. Set up nightly monitoring
# Add to crontab
0 2 * * * kafkaguard scan --bootstrap kafka:9092 \
  --policy policies/finance-iso.yaml \
  --upload http://kafkaguard-api:3001 \
  --alert-slack-webhook "$SLACK_WEBHOOK" \
  --alert-threshold 85
The Community tier — 55 controls, all 4 report formats, Slack/Teams alerts, on-prem dashboard — is free for a single cluster, forever.
For multi-cluster monitoring and compliance framework mapping in reports, Starter plans start at $99/cluster/month.
Download KafkaGuard v2.3.0 →
Read Part 1: Your First Kafka Security Scan →
Read Part 2: The Full 55-Control Compliance Audit →