Pawsman.com's Kafka Cluster Has a Problem
Pawsman.com is a fast-growing pet marketplace — dogs, cats, everything in between. Fifty thousand orders a day flow through their platform. Their engineering team runs a 3-node Confluent Kafka 4.0 cluster (KRaft mode, no ZooKeeper) handling eight production topics:
| Topic | Purpose | Partitions |
|---|---|---|
pawsman.orders | Order placements and updates | 6 |
pawsman.payments | Payment events from Stripe | 6 |
pawsman.user-events | Clicks, searches, logins | 12 |
pawsman.product-views | Product page impressions | 12 |
pawsman.pet-profiles | Pet registration and health data | 3 |
pawsman.inventory | Stock levels and updates | 3 |
pawsman.notifications | Email/push notification events | 3 |
pawsman.vet-appointments | Telemedicine booking events | 3 |
Their CTO got a call from their Series B investors: "We'll need a SOC 2 Type II report before close." That was six weeks ago. Nobody on the team had ever done a Kafka security audit.
This is a three-part series documenting exactly what happened — using KafkaGuard v2.3.0, the real cluster, and real findings.
Part 1 covers installation and the first baseline scan. No configuration changes yet — just the raw truth about where the cluster stands today.
Step 1: Download the KafkaGuard v2.3.0 On-Prem Bundle
Pawsman's team downloads the Community edition directly from the public releases repository. No account needed, no credit card, no trial expiry.
The on-prem bundle is a single tar.gz that contains the CLI binary, the Docker Compose stack, the installer scripts, and the policy library — everything needed for both one-off scans and the dashboard build-out in Part 3.
# macOS Apple Silicon (their dev machines)
curl -LO https://github.com/KafkaGuard/kafkaguard-releases/releases/download/v2.3.0/kafkaguard-onprem-v2.3.0-Darwin_arm64.tar.gz
tar -xzf kafkaguard-onprem-v2.3.0-Darwin_arm64.tar.gz
cd kafkaguard-onprem-v2.3.0/
sudo mv kafkaguard /usr/local/bin/
The bundle ships:
kafkaguardCLI binarydocker-compose.onprem.ymlenv.onprem.exampleinstaller/— backup, restore, upgrade, check-portspolicies/— baseline-dev, enterprise-default, finance-iso
Verify the installation:
kafkaguard version
KafkaGuard v2.3.0
Commit: b0e84f7
Built: 2026-05-03T18:17:58Z
Go: go1.25.3 darwin/arm64
Check whether you're on the latest release (skip the network call with --offline for air-gapped sites):
kafkaguard version --check
KafkaGuard v2.3.0
Commit: b0e84f7
Built:  2026-05-03T18:17:58Z
Go:     go1.25.3 darwin/arm64

✅ You are on the latest version (v2.3.0)
Single binary, zero dependencies, 21MB. It runs anywhere Go runs — Linux, macOS, Docker, CI.
Verify integrity before running: Always check the SHA-256 checksum.
curl -LO https://github.com/KafkaGuard/kafkaguard-releases/releases/download/v2.3.0/bundle-checksums.txt
shasum -a 256 -c bundle-checksums.txt
# kafkaguard-onprem-v2.3.0-Darwin_arm64.tar.gz: OK
Step 2: Run the First Scan
KafkaGuard ships with three built-in policies. For a first look at an existing cluster, baseline-dev is the right starting point — it covers 21 reliability and operational controls without requiring any authentication to be set up first.
kafkaguard scan \
  --bootstrap pawsman-kafka-01:9092 \
  --policy policies/baseline-dev.yaml \
  --format json,html \
  --out ./pawsman-audit-may2026
The scan completes in 131ms. Here is the full terminal output, unedited:
KafkaGuard v2.3.0
Scan tier: community
🔍 Auto-detecting security protocol from broker metadata...
✅ Auto-detected security protocol: PLAINTEXT

Starting KafkaGuard scan  scan_id=d0c3cd34
🔄 Initializing scan...
   Bootstrap: pawsman-kafka-01:9092
   Policy:    policies/baseline-dev.yaml

📊 Collecting Kafka cluster data...
   KRaft mode detected — collecting controller quorum metadata
   ✅ KRaft controller quorum data collected successfully

✅ Evaluating security controls...

   PASS  KG-016  Replication factor ≥ 3                      HIGH
   PASS  KG-017  In-sync replicas ≥ 2                        HIGH
   PASS  KG-018  Default replication factor ≥ 3              HIGH
   PASS  KG-019  Unclean leader election disabled            CRITICAL
   PASS  KG-020  Replication factor for all topics           MEDIUM
   PASS  KG-021  Min ISR per topic                           MEDIUM
   PASS  KG-022  Offsets topic replication factor            HIGH
   PASS  KG-023  Broker version consistency                  MEDIUM
   PASS  KG-029  Log retention configured                    HIGH
   PASS  KG-031  Transaction state replication               LOW
   PASS  KG-032  Log segment size configured                 LOW
   PASS  KG-033  Producer idempotence available              MEDIUM
   PASS  KG-035  Default partitions configured               LOW
   PASS  KG-036  Message max bytes configured                LOW
   PASS  KG-037  Group initial rebalance delay               LOW
   PASS  KG-038  Controller rebalance rate                   LOW
   PASS  KG-039  Heap usage                                  LOW

   FAIL  KG-028  Auto-create topics disabled                 MEDIUM
   FAIL  KG-030  Delete topic disabled                       MEDIUM
   FAIL  KG-034  Network threads appropriate                 LOW
   FAIL  KG-040  GC logging enabled                         LOW

📝 Generating reports...

good compliance score  score=83.8%  passed=17  failed=4  total=21

✅ Reports saved to ./pawsman-audit-may2026/
   scan-20260503-d0c3cd34.json   (34 KB)
   scan-20260503-d0c3cd34.html   (75 KB)

✅ Scan complete!  scan_id=d0c3cd34  duration=131ms
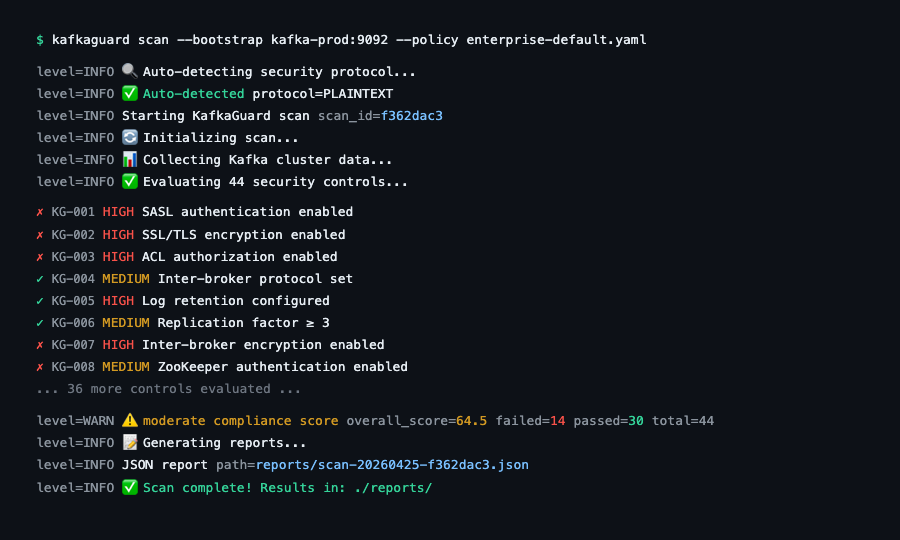
The CLI running a scan — real-time control evaluation streaming to the terminal.
Score: 83.8% on the first pass. 17 of 21 reliability and operational controls pass. For a cluster that was set up without a security checklist, that's a reasonable starting point — but it's only 21 controls. The real picture emerges in Part 2 when we run the full 55-control audit.
Understanding the Four Failures
KG-028 — Auto-Create Topics Disabled ⚠️ MEDIUM
What it means: Kafka is configured to automatically create a topic the first time a producer or consumer references it. This is fine in development but catastrophic in production.
Why it matters for Pawsman: A bug in their notification service once caused pawsman.notifications-v2 to be silently created with default settings — replication factor 1, no retention policy. It processed 3 days of notification events before anyone noticed the data wasn't in the right topic. With auto.create.topics.enable=false, that bug would have thrown an immediately visible exception instead.
Remediation:
# server.properties on all brokers
auto.create.topics.enable=false
Restart brokers rolling (one at a time) to apply without downtime.
KG-030 — Delete Topic Disabled ⚠️ MEDIUM
What it means: delete.topic.enable=true means anyone with broker access can delete a topic permanently. On a Kafka 4.0 KRaft cluster with no ACLs, that's anyone who can reach the broker.
Why it matters for Pawsman: Their pawsman.payments topic contains payment event data they're legally required to retain for 7 years under PCI-DSS. Accidental deletion would be a compliance violation and a data loss incident simultaneously.
Remediation:
# server.properties on all brokers
delete.topic.enable=false
Note: On Kafka 4.0 KRaft clusters, this setting prevents deletion via the Admin API but does not prevent controller-level operations. Pair with ACL controls (covered in Part 2) for defense in depth.
KG-034 — Network Threads ⚠️ LOW
What it means: num.network.threads is set to the default (3), which is appropriate for a development cluster but insufficient for Pawsman's 12-partition user-events and product-views topics under peak load.
Remediation:
num.network.threads=8
KG-040 — GC Logging Disabled ⚠️ LOW
What it means: JVM garbage collection logging is off. When brokers have a GC pause that causes consumer lag or a rebalance, there's no trace to diagnose it.
Remediation:
# In kafka-server-start.sh or KAFKA_OPTS environment variable
export KAFKA_OPTS="-Xlog:gc*:file=/var/log/kafka/gc.log:time,level,tags:filecount=10,filesize=100m"
Reading the JSON Report
The JSON report is machine-readable and CI/CD friendly. Here's an excerpt showing the structure:
{
  "scan_id": "d0c3cd34-2fe3-474a-a05b-2f7ccccc80f6",
  "cluster": {
    "name": "pawsman-kafka-prod",
    "brokers": 3,
    "topics": 8,
    "cluster_mode": "kraft"
  },
  "timestamp": "2026-05-03T22:03:36+10:00",
  "score": {
    "total": 83,
    "max": 100,
    "percentage": 83.78
  },
  "summary": {
    "total": 21,
    "passed": 17,
    "failed": 4,
    "na": 0
  },
  "findings": [
    {
      "control_id": "KG-028",
      "title": "Auto-create topics disabled",
      "status": "fail",
      "severity": "MEDIUM",
      "category": "operational",
      "description": "auto.create.topics.enable must be false in production",
      "remediation": "Set auto.create.topics.enable=false in server.properties"
    },
    {
      "control_id": "KG-016",
      "title": "Replication factor ≥ 3",
      "status": "pass",
      "severity": "HIGH",
      "category": "reliability"
    }
  ]
}
This output drops directly into any pipeline:
# Count failed HIGH-severity controls (for CI/CD gate)
jq '[.findings[] | select(.status=="fail" and .severity=="HIGH")] | length' scan.json

# Export to CSV for Jira import
kafkaguard scan --format csv --out ./reports
The HTML Report
Open the generated HTML file in any browser:
open ./pawsman-audit-may2026/scan-20260503-d0c3cd34.html
The HTML report includes:
- Executive summary with score gauge and severity breakdown
- Full control table with pass/fail status, severity, and one-click expandable remediation
- Cluster metadata — broker count, KRaft mode detected, Confluent version
- Print-friendly — exports cleanly to PDF from the browser for stakeholder reviews
Where Pawsman Stands After Part 1
| Category | Controls | Passed | Failed | Score |
|---|---|---|---|---|
| Reliability | 13 | 13 | 0 | 100% |
| Operational | 8 | 4 | 4 | 50% |
| Total (baseline-dev) | 21 | 17 | 4 | 83.8% |
The good news: Pawsman's cluster is reliably configured. Replication factors, ISR settings, and KRaft quorum health all pass. The failures are operational hygiene issues — fixable in an afternoon.
The not-so-good news: baseline-dev's 21 controls only cover reliability and operations. It doesn't touch authentication, encryption, or authorization at all. That's where things get uncomfortable.
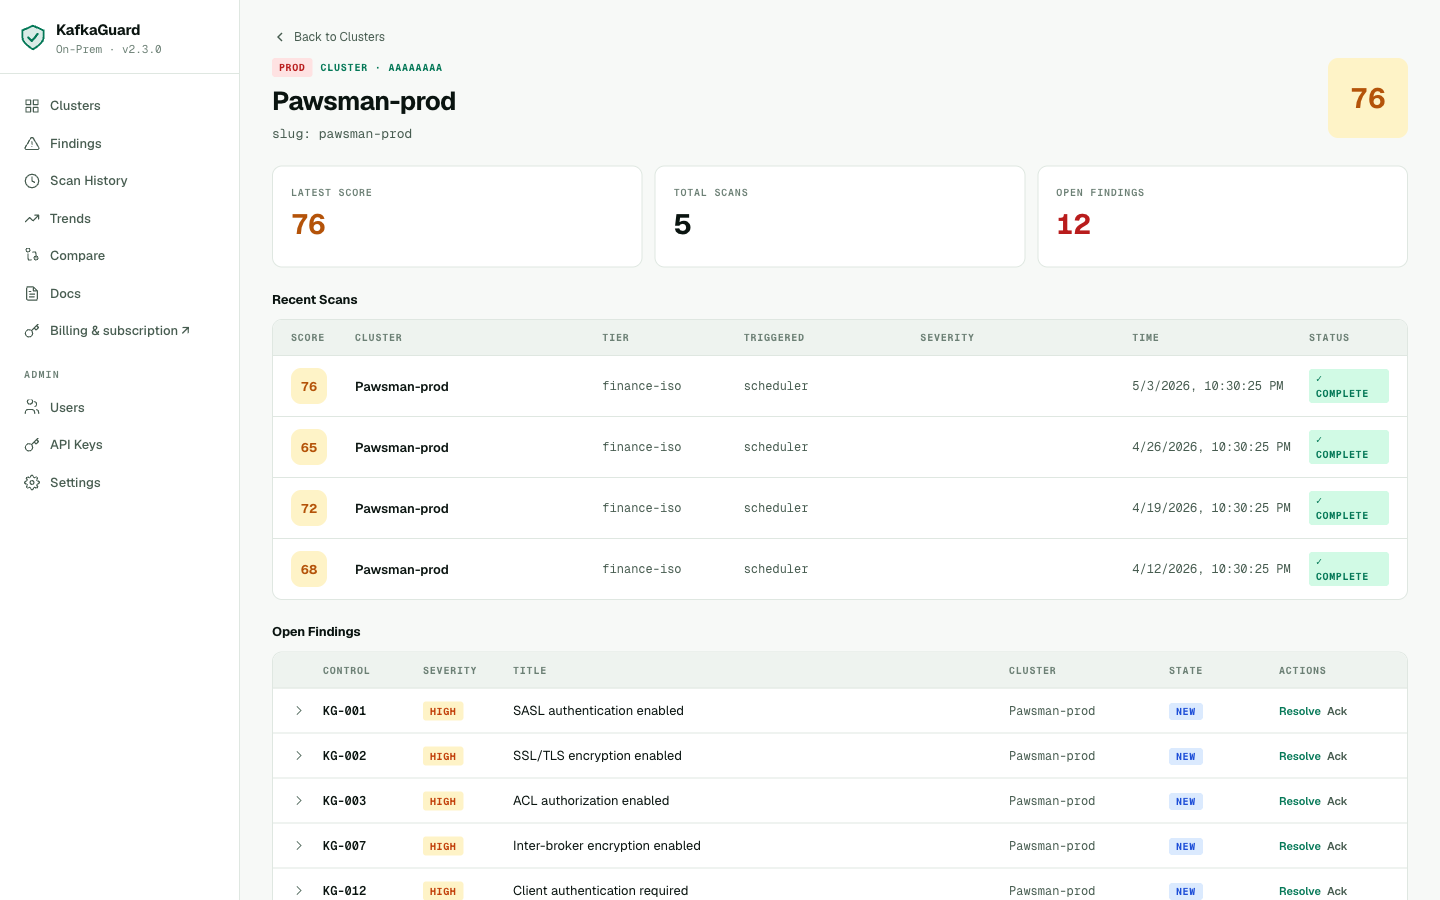
A Sneak Peek: The Dashboard
Once findings are uploaded to the KafkaGuard on-prem dashboard (covered in Part 3), every scan is tracked in one place. Here's what Pawsman's cluster looks like after a few weeks of continuous scanning:
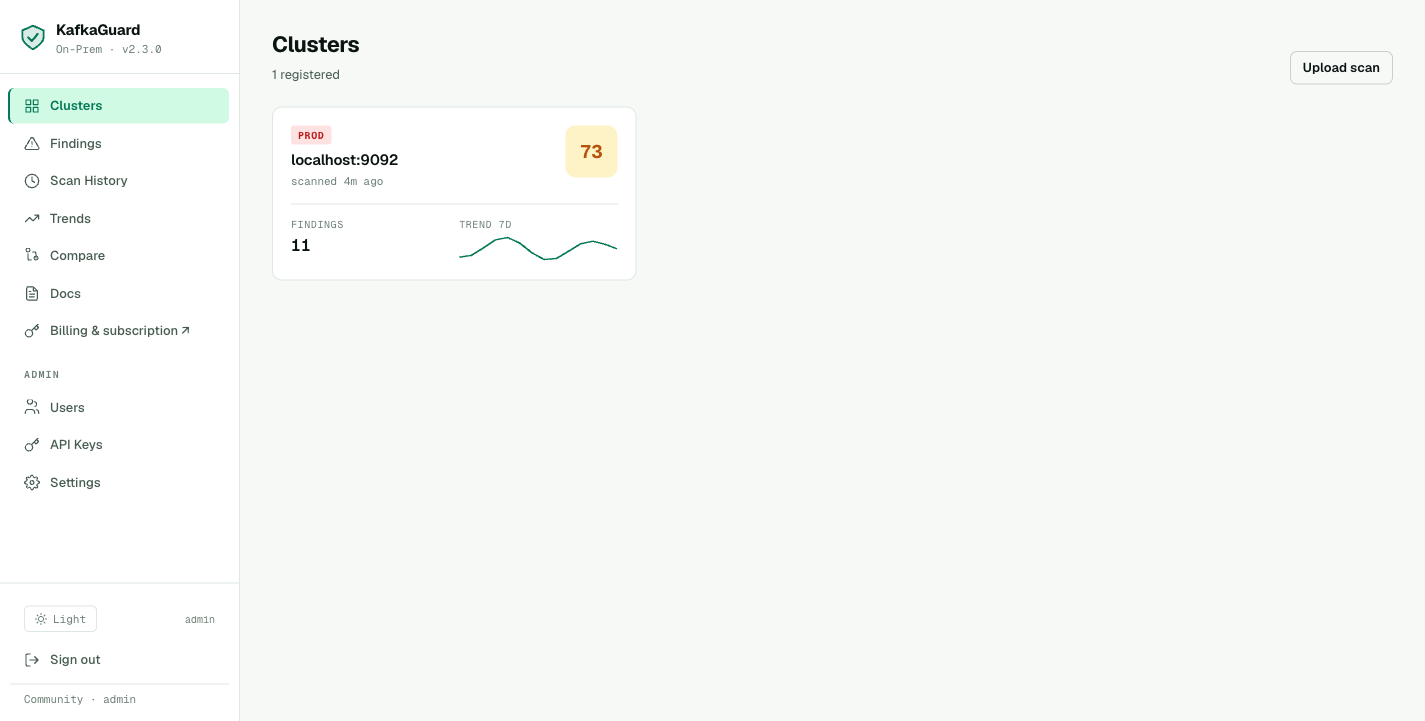
The clusters overview — compliance score, open findings count, and last scan time at a glance.
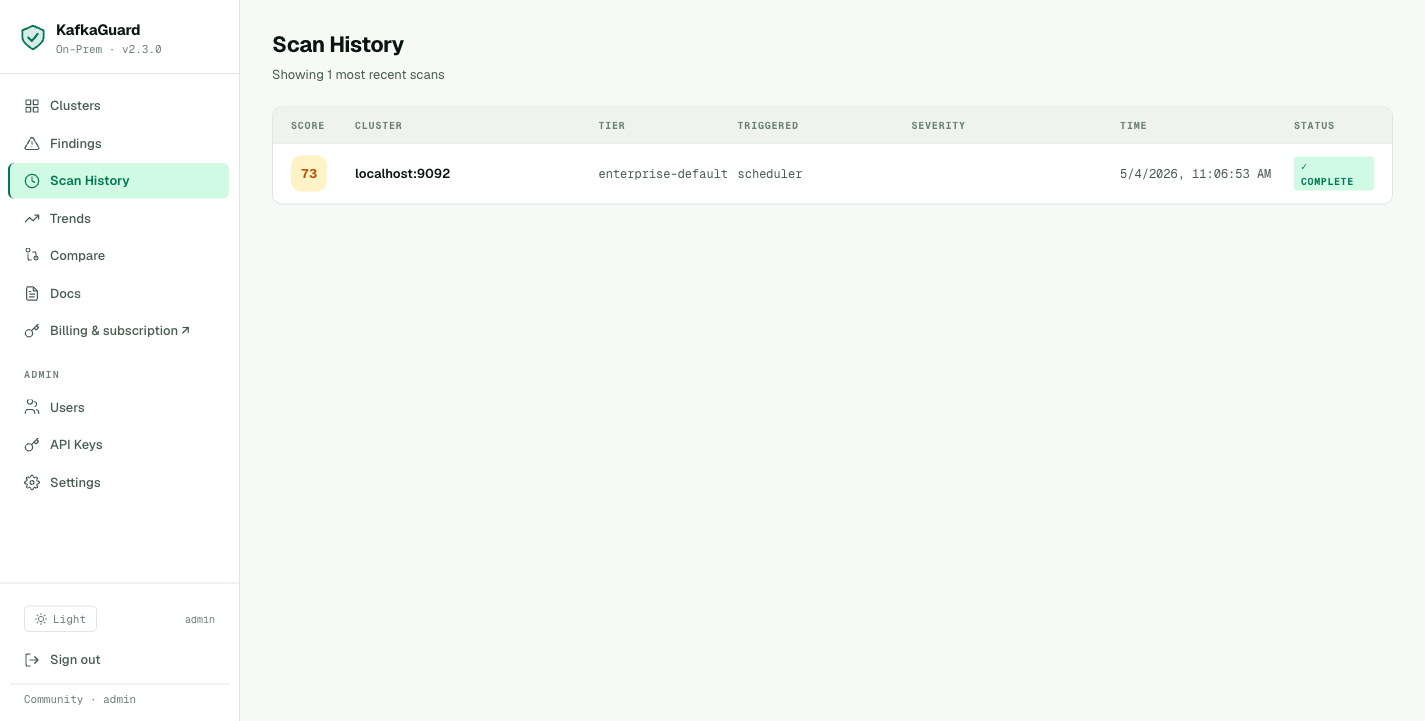
Every scan in the history timeline — score trend, policy used, and who uploaded it.
We'll set this up in Part 3. For now, the CLI JSON and HTML reports are everything you need.
What's in Part 2
In Part 2, we run the finance-iso policy — all 55 controls, including the security controls that baseline-dev skips entirely. We'll generate the PDF audit report, walk through the PCI-DSS and SOC 2 compliance mapping, and show Pawsman's path from 67.8% to SOC 2 readiness.
Spoiler: KG-001, KG-002, and KG-003 all fail. Payment data is flowing over PLAINTEXT Kafka with no authentication and no ACLs.
→ Continue to Part 2: The Full 55-Control Compliance Audit
Try It Yourself
Everything in this guide uses the free Community edition. No account required.
# Download the on-prem bundle (CLI + compose + policies included)
curl -LO https://github.com/KafkaGuard/kafkaguard-releases/releases/download/v2.3.0/kafkaguard-onprem-v2.3.0-Darwin_arm64.tar.gz
tar -xzf kafkaguard-onprem-v2.3.0-Darwin_arm64.tar.gz
cd kafkaguard-onprem-v2.3.0/
sudo mv kafkaguard /usr/local/bin/

# Scan your cluster
kafkaguard scan --bootstrap your-kafka:9092 --policy policies/baseline-dev.yaml --format html
The Community tier includes 55 controls, all 4 report formats (JSON, HTML, PDF, CSV), and Slack/Teams alerts — free for a single cluster, forever.